
A process bottleneck almost always shows up as a growing queue at one step, not general chaos across the board. To confirm it, track three numbers for a week: work-in-progress (WIP), throughput and lead time. If one step’s lead time keeps climbing while everything before it stays flat, you’ve found your constraint. Run the check this afternoon with a spreadsheet, and watch for three straight weeks of queue growth before calling it chronic.
TL;DR:
- The primary bottleneck is identified by a steady increase in lead time at one step while preceding steps remain stable, confirmed over at least three weeks.
- Mapping a single process end-to-end, including wait times and queue data, is essential before measuring WIP, throughput, and lead time to locate the true constraint accurately.
- When multiple bottlenecks exist, prioritize fixing the one with the highest impact based on a combined score of volume, wait time, and error rate, rather than addressing all constraints simultaneously.
- Continuous monitoring of key KPIs like WIP, cycle times, and SLA breaches is necessary to prevent bottlenecks from reappearing or shifting over time.
- Implementing small-scale simulations and pairing process mining with staff interviews helps verify potential fixes and avoid costly investments in ineffective solutions.
Table of Contents
- What a process bottleneck actually is
- Map the process before you touch anything
- Measure WIP, throughput and lead time to pinpoint the constraint
- Observe queues and talk to the people doing the work
- When process mining and workflow analytics earn their place
- Classify the root cause before choosing a fix
- Score bottlenecks so you fix the right one first
- Keep bottlenecks from creeping back
- FlowLab’s approach to fixing what the audit finds
- Implementing real-time monitoring for bottlenecks that shift
- Using simulation modelling to test a fix before you build it
- Applying Lean and Six Sigma methods to bottleneck detection
- Using value stream mapping to spot delay hiding in plain sight
- Where managers go wrong, and the habits that fix it
- Book a QueueFlow demo or a complimentary fit review
- Sources
- FAQ
What a process bottleneck actually is
A bottleneck is the one step that limits how fast work can move through your entire system, not just a step that feels slow. That distinction matters because teams often confuse general inefficiency with a true constraint. You can have a messy, imperfect process everywhere and still find that only one point actually caps your output.
Bottlenecks tend to fall into five recognisable types: a decision that sits waiting for approval, a capacity shortfall (not enough staff or machines), a tooling or system limitation, a quality problem that forces rework, or a single person who has become the unofficial gatekeeper for a task. The Theory of Constraints makes a simple but often ignored point: fixing anything other than the true constraint won’t increase overall throughput. Speed up a step that isn’t the bottleneck, and the queue in front of the real one just gets longer.
Map the process before you touch anything
You cannot fix what you haven’t traced. Before measuring or interviewing anyone, pick one high-impact workflow, order processing, customer onboarding, invoice approval, and follow a single transaction from the moment it enters the system to the moment it’s resolved.
Here’s a practical sequence for mapping it properly:
- Choose one process, not five. Trying to map everything at once produces a vague chart nobody trusts.
- Walk a real transaction end to end, noting every handoff between people, teams or systems.
- Mark every waiting period, not just active work. A form sitting in someone’s inbox for two days counts.
- Expand your summary steps. What looks like a five-step process on a whiteboard is usually 12 to 20 real steps once you watch it happen.
- Add timing data to each step, how long the work actually takes versus how long it waits, plus how many items are sitting in queue at that point.
That last step turns a simple flowchart into a value stream map, the version that actually reveals where delay accumulates. Managers who skip straight to metrics without mapping first tend to measure the wrong step because they’re still working from an idealised version of the process rather than what’s really happening on the floor.
Measure WIP, throughput and lead time to pinpoint the constraint
Once the map is drawn, the diagnostic gets mathematical rather than guesswork. Three numbers tell you almost everything: work-in-progress (WIP) is how many items are currently in the process at any point, throughput is how many items complete per week, and lead time is how long a single item takes from start to finish. Little’s Law ties them together with one formula:
Lead time = WIP ÷ Throughput
To collect the data, you don’t need specialist software, a spreadsheet and a week of observation will do:
- Pick 15 to 20 items moving through the process (orders, tickets, applications) and timestamp each one at every step.
- Separate active work time from wait time for each step, this distinction matters more than most managers expect.
- Calculate the percentage of total lead time each step consumes.
- Track whether the queue at any single step is growing week over week rather than staying flat.
Statistic to watch: a widely used rule of thumb from national productivity guidance states that if work waits at a step for more than 50% of the total cycle time, that step needs immediate investigation. In practice, the step consuming the largest share of total lead time, and showing a queue that keeps climbing rather than fluctuating, is almost always your real constraint.
Observe queues and talk to the people doing the work
Numbers tell you where the delay sits. People tell you why. A short queue observation combined with a handful of honest conversations often surfaces causes that a spreadsheet never will.
- Watch the queue at peak load. Count how many items are waiting and note the age of the oldest item still sitting there, that single figure often says more than an average.
- Ask the person handing work off what slows them down. Frame it as “what do you wait for before you can act?” rather than “what’s wrong with the process?”
- Ask approvers what makes them delay a decision. Missing information and unclear rules cause more stalled approvals than workload ever does.
- Ask what gets sent back for rework, and why. Rework is one of the most common hidden bottlenecks, and it rarely shows up in a simple time-and-motion count.
- Repeat the queue count for three consecutive weeks. A single busy week is noise. Three weeks of growth in the same step’s queue is a genuine signal, not a blip.
Pro Tip: Ask the same question to three different people doing the same job. If you get three different answers about “the rule,” you’ve found a process design problem, not a people problem.
When process mining and workflow analytics earn their place
Manual mapping and interviews work well for a single process with a handful of people. Once a workflow runs through several digital systems and generates enough logged data, event-log analysis starts to reveal patterns that observation alone would miss.
Process mining and workflow analytics reconstruct the actual paths work takes through a system, rather than the path described in a training manual. That distinction matters because the two are rarely identical. These tools surface variant paths (the different routes similar tasks actually follow), heatmaps that separate idle time from active work at each step, and statistical outliers that a manual sample would likely miss.
To use process mining meaningfully, you need enough event data, generally hundreds of logged cases, and digital tools stable enough to produce consistent timestamps. Pull three metrics from the logs once you have them:
- Median cycle time versus p90 cycle time. The median tells you what’s typical; the 90th percentile reveals the tail risk that quietly damages service quality even when averages look fine.
- Per-step idle time, not just total duration, so you can see exactly where work sits untouched.
- SLA breach trends over time, whether breaches are increasing, decreasing, or clustering around specific steps.
Process mining explains system behaviour precisely, but it won’t tell you why staff reroute a task or what caused a specific exception. Pair it with the interviews from the previous section rather than replacing one with the other.
Classify the root cause before choosing a fix
Not every bottleneck needs the same medicine. Once you’ve located the constraint, sort its cause into one of four categories, because the wrong fix wastes money and can make things worse.
- Process design flaw: too many approval steps, unclear ownership, or a sequence that forces unnecessary waiting. Fix: redesign the workflow itself.
- Data quality issue: incomplete forms, inconsistent records, or missing information that forces people to chase details manually. Fix: fix data capture at the source, not downstream.
- Tooling mismatch: the system in use can’t handle current volume, or two systems don’t talk to each other. Fix: integrate or replace the tool.
- Capacity or ownership gap: one person or team is overloaded, or a single individual has become an unofficial single point of failure. Fix: redistribute the work or cross-train a backup.
Pro Tip: Never automate a broken process. Automation applied to a flawed workflow just makes the constraint move faster and fail more consistently. Audit first, always, before you commit budget to WordPress publishing automation for content teams.
A quick checklist before deciding your next move: Is the cause structural (design), informational (data), technological (tooling), or human (capacity)? Answer that honestly before choosing between redesign, retraining, or new software.
Score bottlenecks so you fix the right one first
When you find more than one constraint, and most processes have several, rank them before acting. A simple scoring model works: multiply volume (how many items pass through), average wait time, and error or rework rate for each candidate step. The step with the highest combined score deserves attention first.
Here’s how that plays out in practice:
- List every candidate bottleneck you identified during mapping and measurement.
- Score each on a 1 to 5 scale for volume, wait time and error rate.
- Multiply the three scores together for a rough impact ranking.
- Pick the top one or two, resist the urge to fix everything simultaneously.
This whole exercise takes about 15 minutes once you have the underlying data from your mapping and measurement work. After implementing a fix, measure the same three numbers again, WIP, throughput and lead time, to confirm the change actually moved the needle rather than just feeling like progress.
Keep bottlenecks from creeping back
Fixing a constraint once doesn’t guarantee it stays fixed. Monitoring is what separates a permanent improvement from a temporary patch.
Five KPIs are enough for most SME teams to track weekly:
- Median cycle time per process, your baseline for “normal.”
- P90 cycle time, the early-warning metric that catches tail-end delays before they become the norm.
- WIP per step, so a growing queue gets flagged immediately.
- Throughput per week, to spot a slowdown before it compounds.
- SLA breach rate, the clearest signal that customers are starting to feel the delay.
Set alerts at practical thresholds: if WIP at any step grows for two consecutive weeks, or p90 cycle time exceeds double the median, flag it for review. A short weekly check-in with step owners, backed by a simple bottleneck register listing what’s being watched and why, catches recurrence long before it becomes a customer complaint.
FlowLab’s approach to fixing what the audit finds
Diagnosing a bottleneck is only half the job. Once you know whether the fix is a process redesign, a data cleanup, or genuinely needs new tooling, someone has to build it. A practical approach is to translate an audit into a practical solution without unnecessary technical jargon or sales pressure.
The approach starts with understanding the operational problem before recommending anything:
- The approach starts with reviewing the actual workflow first, then suggests a ready-made product, an adapted version, or a custom build, whichever is genuinely the most economical route.
- An app fit review clarifies likely costs before you commit to anything, so there’s no guessing at budget.
- Sector-specific experience, including F&B and retail operations, means the team has seen how queue and order bottlenecks play out in real premises, not just on a whiteboard.
- Product lines like QueueFlow exist precisely because queue-related constraints are among the most common bottlenecks SMEs report.
Confidentiality is respected throughout the review process, and there’s no pressure to commit before the scope and cost are clear.
Implementing real-time monitoring for bottlenecks that shift
Static audits catch bottlenecks that sit still. Many don’t. A step that’s fine on Monday can become the constraint by Thursday if a staff member is out sick, a supplier delivery is late, or demand spikes unexpectedly. Real-time monitoring closes that gap by tracking WIP and wait times continuously rather than through periodic manual checks.
Practically, this means connecting whatever system already runs your workflow, a queue management tool, a ticketing system, an order platform, to a dashboard that updates as work moves rather than waiting for someone to run a report. The value isn’t the dashboard itself; it’s catching a queue building at 11am rather than discovering it in Friday’s weekly review.
For customer-facing queues specifically, real-time visibility does double duty: it tells the manager where the constraint is forming, and it tells the waiting customer roughly how long they’ll be there. That second part matters more than most operations teams assume. A visible, updating queue estimate reduces the perceived pain of waiting even when the actual wait time doesn’t change. This is precisely the mechanic behind tools like QueueFlow, which tracks queue position and estimated wait live rather than leaving customers, and staff, guessing.
The practical threshold for whether real-time monitoring is worth setting up: if your bottleneck moves between different steps depending on the day, staffing, or season, a static audit will always be one step behind. If it sits reliably at the same point week after week, a periodic manual check is probably sufficient.
Using simulation modelling to test a fix before you build it
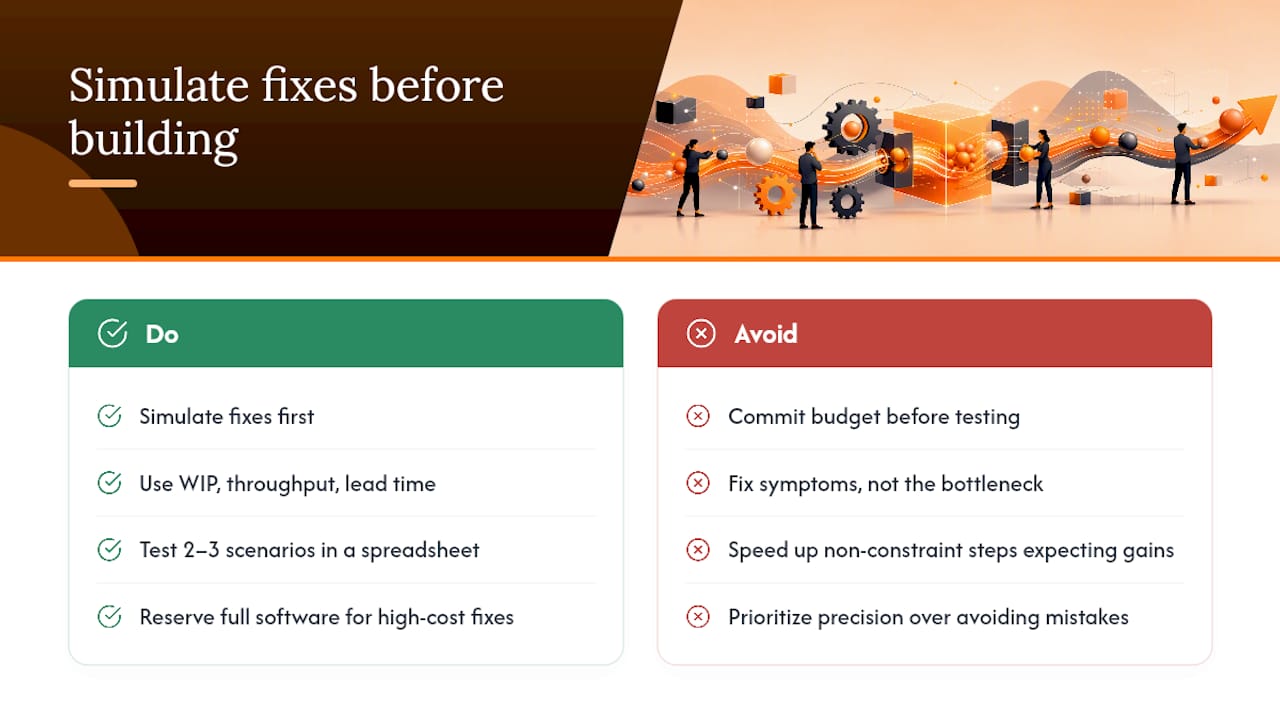
Before committing budget to a redesign or new tooling, simulation modelling lets you test the change on paper, or rather, in software, before touching the real process. The logic is straightforward: build a simplified digital model of your workflow using the WIP, throughput and lead time figures you already collected, then run “what if” scenarios against it.
What if you added a second approver to remove the single-owner dependency you found during interviews? What if you redistributed volume more evenly across two staff members instead of one? Simulation modelling answers these questions with a projected outcome rather than a guess, based on the actual data your process mapping produced.
This matters most when a fix is expensive, hiring, new software, restructuring a team, because testing it virtually first avoids committing resources to a change that looks sensible on a whiteboard but doesn’t actually shift the constraint. It also protects against a common mistake: fixing the symptom rather than the true bottleneck identified through your Theory of Constraints analysis. A simulation will often reveal that speeding up a non-constraint step, however satisfying, produces no measurable change in overall throughput.
For most SMEs, simulation doesn’t require expensive enterprise software. A basic spreadsheet model using your own average processing times, queue lengths and volumes is often enough to test two or three scenarios credibly. The exercise is less about precision and more about avoiding an expensive mistake before it happens. Reserve full simulation software for processes where the cost of getting the fix wrong is genuinely high.
Applying Lean and Six Sigma methods to bottleneck detection
Lean and Six Sigma weren’t built specifically to find bottlenecks, but several of their core tools do exactly that job well. The most directly useful is the distinction Lean draws between value-adding and non-value-adding activity, anything a customer wouldn’t pay for if they could see it happening (waiting, rework, unnecessary approvals) is a candidate for removal, not optimisation.
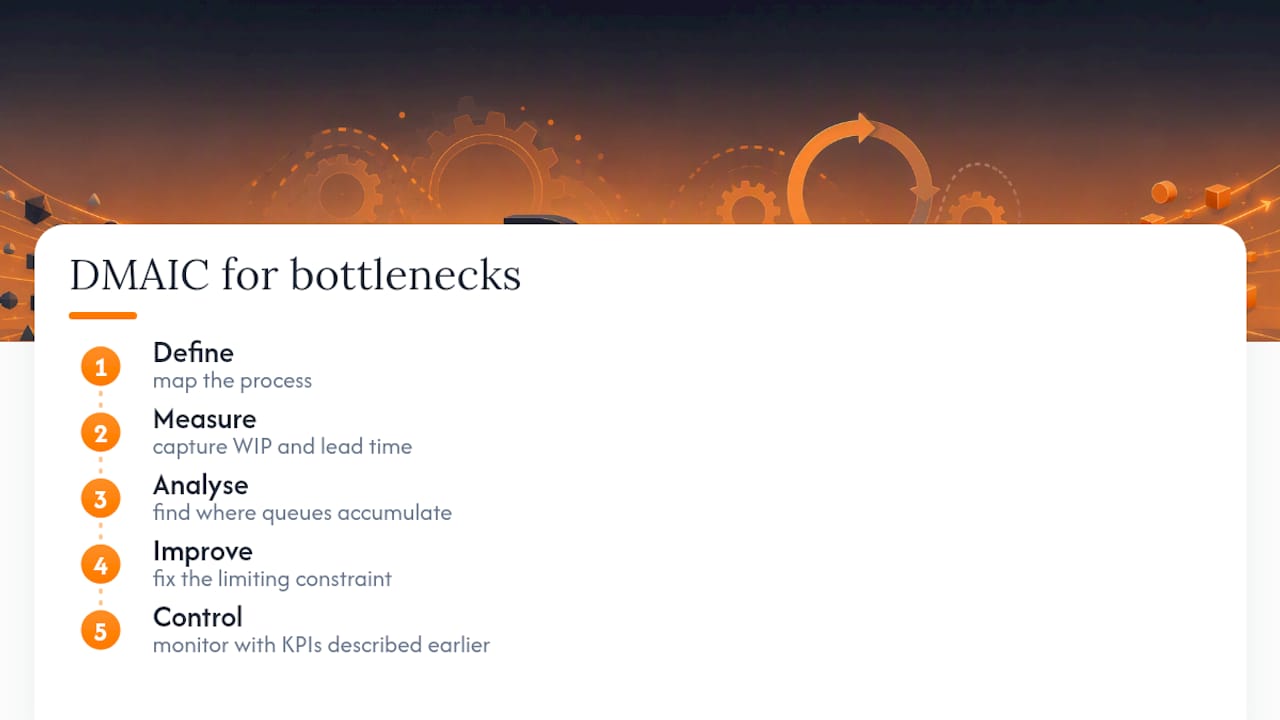
Six Sigma’s DMAIC cycle, Define, Measure, Analyse, Improve, Control, maps closely onto the diagnostic sequence already covered in this article: define the process, measure WIP and lead time, analyse where the queue accumulates, improve the constraint, then control it with the KPI monitoring described earlier. The overlap isn’t a coincidence; both frameworks converge on the same principle as the Theory of Constraints, that you fix the specific point limiting flow, not the whole system indiscriminately.
One Lean concept worth borrowing directly is the “seven wastes” checklist (waiting, overproduction, defects, unnecessary motion, excess transport, over-processing, and unused talent). Running your mapped process against that list often surfaces a bottleneck cause that pure timing data misses, particularly waiting and defects, which show up as delay but get misdiagnosed as a capacity problem.
You don’t need a Six Sigma certification to use these tools practically. The value for a small operations team is in borrowing the questions Lean and Six Sigma ask, not necessarily the full statistical apparatus built for large manufacturing environments. Ask “does this step add value a customer would recognise?” for every step in your map, and the honest answers usually point straight at the constraint.
Using value stream mapping to spot delay hiding in plain sight
Value stream mapping deserves its own explanation because it does something a standard flowchart doesn’t: it separates value-adding time from waiting time visually, step by step, so the ratio between the two becomes impossible to ignore. A typical value stream map for an SME process often shows that actual work happens in a small fraction of total lead time, the rest is queue.
Building one starts with the same walkthrough described earlier in this article, tracing a single transaction from start to finish. The difference is in what you annotate: for every step, record the processing time (how long the work actually takes when someone is doing it), the wait time (how long it sits before the next step begins), and the WIP at that point (how many items are queued there right now).
Once mapped, add up all the processing times and compare that total against the full lead time. The gap between the two numbers is your non-value-adding time, and in most manual processes, it’s larger than managers expect. A five-day approval cycle might contain only 40 minutes of actual review work; the rest is the document sitting in an inbox.
The practical output of a value stream map isn’t the diagram itself, it’s the list of steps where wait time dominates. Value stream mapping won’t tell you why the wait happens, that’s what the interviews and root-cause classification are for, but it tells you precisely where to point those questions.
Where managers go wrong, and the habits that fix it
The most common mistake isn’t ignoring bottlenecks, it’s mistaking busyness for one. A team working flat out on the wrong step still produces a growing queue somewhere else. The second mistake is skipping measurement entirely and acting on instinct, which usually means fixing the loudest complaint rather than the actual constraint. The third, and most expensive, is automating a process nobody has properly audited. Software makes a broken workflow faster at being broken.
What works instead is unglamorous but reliable: measure before you touch anything, fix the highest-impact constraint first rather than the easiest one, and run a short weekly check with the KPIs already in place. None of this requires new software on day one. It requires fifteen minutes with a spreadsheet and the discipline to trust the numbers over the noise.
— Ronald
Book a QueueFlow demo or a complimentary fit review
Flowlab is the practical alternative to guessing at a fix or hiring a large consultancy for a problem you’ve already diagnosed yourself. Once you’ve mapped the process, measured WIP and lead time, and classified the root cause using the steps above, the next move is finding out what a fix actually costs, before committing to anything.

If queue-related delay turned out to be your constraint, try the complete queue journey through a live QueueFlow demo, so you can see exactly how live wait tracking and customer notifications work before deciding anything. Prefer to start with the diagnosis? A complimentary app fit review looks at your specific process and tells you honestly whether a ready-made product like QueueFlow, an adapted version, or a custom build is the most economical route, with ballpark costs clarified upfront. For workflow problems outside queuing, from lead tracking to event registration, the full range of Flowlab’s services covers the same workflow-first process. Get in touch to schedule a session and find out what your bottleneck actually costs to fix.
Sources
- Workflow analysis methods and their use in systems design (PMC)
- The ultimate guide to solving bottlenecks with Camunda: Theory of Constraints
FAQ
How do you identify a bottleneck?
Trace one process end to end, then measure WIP, throughput and lead time at each step using Little’s Law to calculate where delay concentrates. The step with a growing queue and the largest share of total lead time is your constraint, confirmed by observing queue growth over multiple weeks rather than a single busy day.
What does process bottleneck mean?
A process bottleneck is the single step that limits how much work the entire system can complete, regardless of how efficient other steps are. It’s distinct from general inefficiency because fixing a non-constraint step, however wasteful, won’t increase overall output according to the Theory of Constraints.
What are examples of bottlenecks?
Common examples include an approval sitting on one manager’s desk, a single staff member who’s become the only person who understands a task, a system that can’t process current order volume, and a quality check that sends work back for rework repeatedly. Queue buildup at a service counter or checkout, the kind QueueFlow is built to track, is one of the most visible versions for customer-facing SMEs.
What are the two types of bottlenecks?
Bottlenecks are broadly grouped as short-term (temporary, caused by a one-off spike in demand or a staff absence) and long-term or chronic (a structural constraint that persists week after week regardless of workload). Measuring queue growth over three consecutive weeks is the practical way to tell which type you’re dealing with before deciding how urgently to act.